Distance and Angle Aren't Enough: Why Our xG Model Splits the Ice Into Zones
2026-07-20 · methodology · xG
A pure distance-and-angle expected-goals model looks reasonable — and quietly misprices the whole ice. We map exactly where it goes wrong, then show how zone, rush, and prior-event features lift out-of-sample AUC from 0.70 to 0.84.
Figures computed 2026-07-20, against the models as they stood that day. We change them — see the methodology page for where they are now.
- A pure distance-and-angle xG model looks reasonable and quietly misprices the ice — it under-rates the slot and over-rates sharp-angle shots beside the net.
- We map it the way independent analyst Lars Skytte did — actual minus expected shooting % by location — and the errors light up in exactly those spots.
- Adding danger zones, rebound/rush, and prior-event context lifts out-of-sample discrimination from 0.70 to 0.84 AUC and pulls calibration from 1.05 to a near-perfect 1.00.
- A location map can only show spatial errors; most of the gain is context a map can't draw — which is the whole point.
The simplest expected-goals model you can build uses two numbers: how far the shot was from the net, and at what angle. It's intuitive, it's easy to explain, and it's wrong in a specific, mappable way — one you can only see if you go looking for it.
We're not the first to notice. Lars Skytte, an independent analyst at hockey-statistics.com, ran the diagnostic that exposes it: take a distance-and-angle model, and for every spot on the ice, subtract what it expected to happen from what actually happened. If the model were perfect, the map would be flat gray noise. It isn't. It lights up in two places — and those two places are the whole story of why a modern xG model needs more than geometry.
Our model already carries the fix. This post shows the problem on our own data, and what closes it.
The map that shows the problem
Here's the residual — actual shooting percentage minus a distance-and-angle model's expectation, by location, at 5-on-5 (net at the right; red = the model predicts too few goals there, blue = too many):
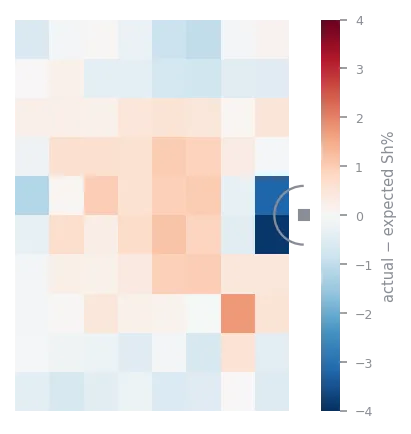
Two things jump out:
- The slot glows red — the model is too low. Right in front of the net, distance-and-angle under-rates the danger. It sees "medium distance, decent angle" and prices an average shot, but the slot is where rebounds, deflections, and scrambles turn into goals at a rate the geometry alone doesn't capture.
- The cells flanking the net are deep blue — the model is too high. From a sharp angle a few feet out, raw geometry screams "close!" and inflates the chance — but a shot from beside the post, with almost no net to shoot at, scores far less often than its distance suggests.
The geometry lies at the extremes, because the same distance-and-angle coordinates mean very different things depending on exactly where on the ice the shot happened — and how the play got there.
Why geometry isn't enough
Distance and angle are smooth, continuous inputs. But shot danger isn't smooth — it has neighborhoods. The slot is a different country than the point, and the sharp-angle area beside the net plays by its own rules a distance number can't express. A model fed only distance and angle is forced to draw smooth contours over an ice surface where the truth has hard edges.
Skytte's prescription was blunt: split the ice into zones and let the model treat them as their own categories. That's exactly what we do — and it's one reason our model reads 53 features instead of two.
What our model adds
Three families of features do the work the geometry can't:
- Danger zones (the "house"). We tag every shot high-, medium-, or low-danger by where it originated — the slot "house," the mid-range, the perimeter — as explicit categories, not just an (x, y) the model has to interpret. It's the direct answer to the residual: it lets the model price the slot and the sharp-angle areas on their own terms.
- How the play developed. Rush chances (a shot within ~4 seconds of a zone entry) and rebounds (within ~3 seconds of a save) are different animals than a settled point shot from the same spot — the goalie hasn't reset, the defense is scrambled. Prior-event features carry that context.
- Shot side and handedness. A left-handed shooter firing from the right side — the off-wing one-timer — gets a better look at the far corner. We model on-wing vs off-wing directly.
Feed those in, and the worst error shrinks:
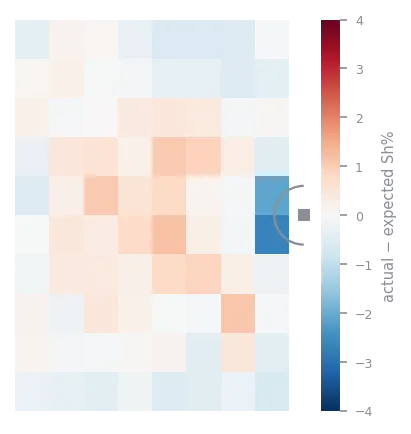
The sharp-angle cells beside the net — distance-and-angle's biggest miss — fade to roughly half their size. The slot cools too. But it doesn't go perfectly flat, and that's the honest part: a location map can only show the errors that are about location. Most of the remaining gap between the two models isn't spatial at all — it's whether the shot was a rebound, a rush, or a settled point shot, which two identical (x, y) coordinates can't tell apart. Which is exactly why the full model needs more than a map's worth of features.
How much does it actually buy?
A prettier map is nice; a better model is the point. To isolate what the extra features do, we ran a clean controlled test: the same gradient-boosting algorithm, trained on 2019-2024 and scored out-of-sample on 2024-25 five-on-five shots — so the only thing that changes between the two rows is the feature set.
| Model (same algorithm, out-of-sample) | EV AUC | Log loss | Calibration |
|---|---|---|---|
| Distance + angle only | 0.70 | 0.183 | 1.05 |
| + zones, rebound/rush, prior-event | 0.84 | 0.157 | 1.00 |
Adding the neighborhood lifts discrimination from 0.70 to 0.84 AUC. Just as important, it pulls calibration from 1.05 (the bare model over-predicts goals by about 5% in aggregate) to a near-perfect 1.00. That second number is the one that matters most downstream: our xG gets summed into GAR and market value, so a probability that's trustworthy in aggregate counts as much as one that ranks individual shots well.
(This is a controlled ablation to isolate the features, not our production model — so the 0.84 here isn't directly comparable to the production figures, which are measured on different shot sets. The full four-model system is validated separately, including a matched-shot head-to-head against MoneyPuck it wins overall and at even strength. See How Our xG Model Works.)
The honest ceiling
Zones fix the problem geometry creates. They don't fix the problem the data creates. The NHL's public play-by-play records no passes, so the cross-ice feed that turns a good chance into a great one is invisible to every public model — ours included. That's why power-play xG is hard for everyone: we sit around 0.72 AUC there, and Evolving Hockey independently reports about the same. Public pre-shot data caps power-play discrimination near there; pushing past it means leaning on signal beyond the pre-shot chance itself — a line we choose not to cross. Splitting the ice into zones is the best you can do with the data everyone has — and it's a real, measurable step past distance and angle.
For the full model — the four situation-specific models, the training, the head-to-head vs MoneyPuck — see How Our xG Model Works and the methodology page.
Frequently Asked Questions
Why isn't distance and angle enough for an expected goals model?
Distance and angle are smooth, continuous inputs, but shot danger isn't smooth — it has neighborhoods. A residual map (actual minus expected shooting % by location) of a pure distance-and-angle model lights up in two places: the slot runs red because the model under-rates it, and the sharp-angle cells beside the net run deep blue because the model over-rates them. The same distance-and-angle coordinates mean very different things depending on exactly where the shot happened and how the play got there.
What features does Hockey Alchemy's xG model add beyond distance and angle?
Three families of features do the work geometry can't: danger zones (tagging each shot high-, medium-, or low-danger by origin — the slot 'house,' mid-range, perimeter — as explicit categories); how the play developed (rush chances within ~4 seconds of a zone entry and rebounds within ~3 seconds of a save, carried by prior-event features); and shot side and handedness (on-wing vs off-wing). In total the model reads 53 features instead of two.
How much does adding zone and context features improve the xG model?
In a controlled ablation — the same gradient-boosting algorithm trained on 2019-2024 and scored out-of-sample on 2024-25 five-on-five shots — adding zones, rebound/rush, and prior-event features lifts discrimination from 0.70 to 0.84 AUC and pulls calibration from 1.05 to a near-perfect 1.00. Calibration matters most downstream because xG gets summed into GAR and market value.
More from the Notebook
How We Rebuilt Our Expected Goals Model
Measured on shots it had never seen, our old expected goals model was not as good as we thought. We found where the data and the model were wrong and rebuilt both. Here is what changed, why, and how much better the new model is.
Talent vs Production: Why the Box Score Misleads
Two wingers score 20 goals; only one of them will do it again. The gap between what a player produced and the process underneath it is the most useful idea in hockey analytics - and it is the split our expected-goals and finishing models are built to make.
Why Public Hockey Analytics Is Imperfect
An honest accounting of where public hockey analytics hits a wall — the data ceiling (the feed records no passes, tracking drifts, private camera models see more) and the bigger problem now: a discourse that shares cards without meaning, rewards certainty over nuance, and stopped teaching. With the Zach Hyman case as the tell.