Who Can Afford Nikita Kucherov? The Trade Request from Three Sides
2026-10-31 · Nikita Kucherov · Lightning · WAR · analytics
Nikita Kucherov wants out of Tampa Bay at 33. Our numbers say he isn't declining, elite forwards age slowly, and the right fit is a team that can put a defensive winger next to him.
Figures computed 2026-10-31, against the models as they stood that day. We change them — see the methodology page for where they are now.
Nikita Kucherov, in the final year of his contract, has asked for a trade out of Tampa Bay. Sportsnet’s Elliott Friedman first reported on Friday, and ESPN’s Emily Kaplan confirmed, that the reigning Hart Trophy winner has told the Lightning he won't re-sign when his eight-year, $9.5 million-a-season contract runs out this summer, and he wants to be traded now. General manager Julien BriseBois answered that Tampa Bay has “unequivocally” no intention of moving him.
Kucherov is still a top 5-10 player in the NHL but age is now a consideration for all parties involved. He turns 34 in June, and the usual worry is that a team trading for him, then paying him, is buying the decline. So I looked at it from all three sides: what Kucherov is worth, what Tampa loses, and what a contender actually gets. Then the part that decides whether a trade works: which teams need what he does, the role he'd play there, and the line he'd play on.
TL;DR
- He isn't declining yet. 6.2, 5.4 and 5.3 wins above replacement the last three seasons, second in the NHL last year. Elite forwards fade slowly, and our model values ages 34 to 38 at about $79 million, roughly $15.8 million a season.
- Tampa still makes the playoffs without him, but it gets harder to go deep. Its playoff odds slip from 96% to 89%, its chance of winning a round from 57% to 45% and its Cup odds from 7.3% to 4.0%. If he walks as a free agent in July, it gets nothing.
- For a contender, he roughly doubles the Cup odds. Carolina from 32.4% to 41.8%, Colorado from 10.8% to 18.3%, Vegas from 7.0% to 11.6%, Utah from 6.7% to 11.0%, and Minnesota and Montreal from 4.9% to 9.4%.
- The line decides it. His lines get better with a linemate who defends, not one who hits. He'd play on any buyer's top line: Minnesota's already defends, Vegas's would with one move, and Montreal's is among the weakest defensive fits.
- Verdict: Vegas is the best fit, Minnesota the most natural, Carolina the best value, Montreal the hardest to get right.
Kucherov: selling at the top
Start with what he's been. Our wins above replacement (WAR) measures how many wins a player adds over a fringe NHLer, from his even-strength play at both ends, power play, penalties and finishing. Kucherov was worth 6.22 in 2023-24, 5.36 in 2024-25 and 5.25 last season, the second-most in the league behind Connor McDavid (6.73). Over the last four seasons only McDavid (25.0) and Nathan MacKinnon (22.3) added more than his 21.5.
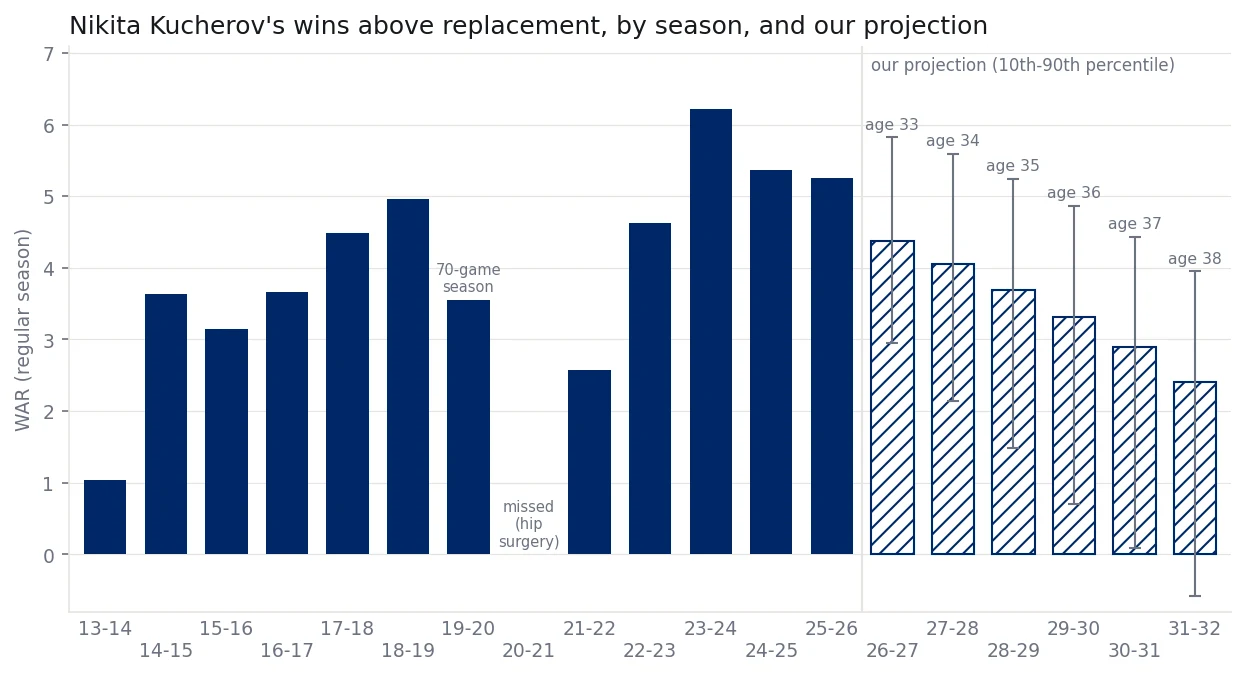
The model does expect him to slip: 4.37 this season (a range of 2.95 to 5.82), then a little less each year. That's a gentle slope, and it's worth checking against history. We took every forward since 2010-11 who averaged at least 2.5 WAR a season from 30 to 32, twenty of them, and followed them forward, counting a season out of the league as zero.
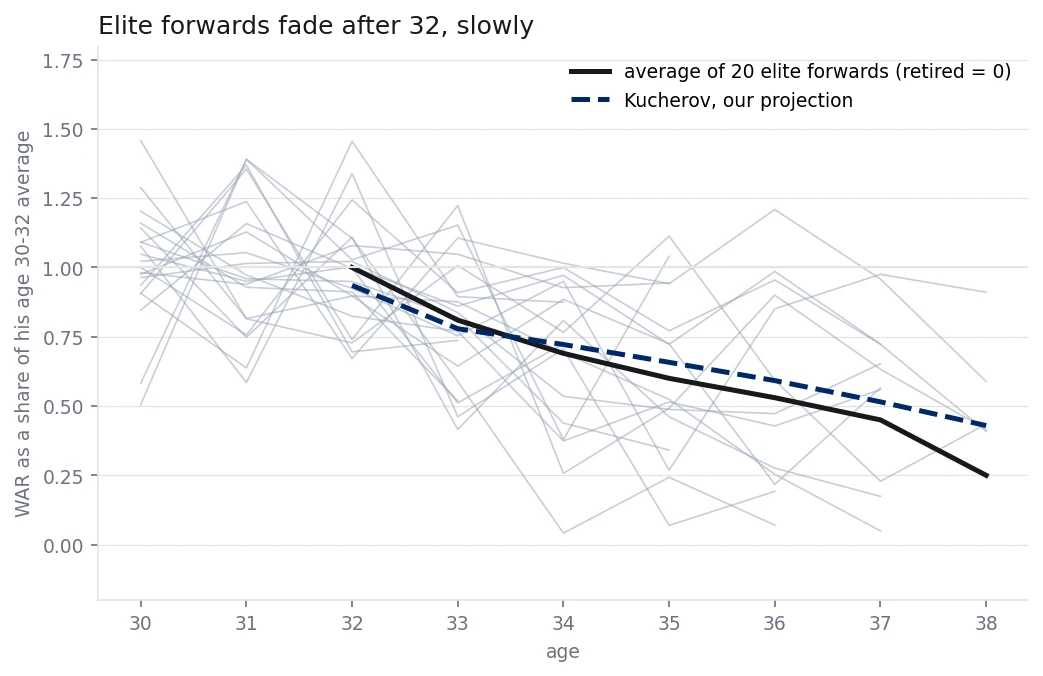
On average they kept 81% of that value at 33, 69% at 34, 60% at 35 and 53% at 36, falling to 25% at 38 as players retired. Sidney Crosby, Alex Ovechkin and Joe Pavelski barely dipped; Max Pacioretty and Patrick Sharp fell off quickly. And Kucherov sits above all of them: he averaged 5.61 WAR from 30 to 32, where the best of the twenty, Artemi Panarin, averaged 3.95.
That's the case for Kucherov pushing now. He's paid $9.5 million; our market-value model puts this season's play at about $17.9 million. Priced year by year with the decline built in, a five-year deal from 34 to 38 comes out at about $79 million, roughly $15.8 million a season, from $18.2 million at 34 down to $12.9 million at 38.
| Season | Age | Projected WAR | Range (10th-90th) | Market value | Range |
|---|---|---|---|---|---|
| 2026-27 | 33 | 4.37 | 2.95 to 5.82 | $17.9M | $12.4M to $23.5M |
| 2027-28 | 34 | 4.05 | 2.14 to 5.59 | $18.2M | $10.1M to $24.7M |
| 2028-29 | 35 | 3.69 | 1.48 to 5.24 | $17.3M | $7.5M to $24.0M |
| 2029-30 | 36 | 3.32 | 0.70 to 4.87 | $16.2M | $4.3M to $23.2M |
| 2030-31 | 37 | 2.89 | 0.09 to 4.43 | $14.7M | $1.5M to $21.9M |
| 2031-32 | 38 | 2.41 | −0.58 to 3.95 | $12.9M | $0.8M to $20.4M |
The ranges are the honest part. By 37 the bottom of the range is a replacement-level player, and that risk sits with whoever signs the deal, not with Kucherov.
Tampa Bay: the cost of saying no
BriseBois can keep him and try to win this season. Our standings projection has the Lightning at 110 points with a 96% chance of making the playoffs. Take Kucherov out, put a one-WAR winger in his place, and that drops to about 89%, roughly four points over the 72 games left. Its chance of winning the Cup falls from 7.3% to about 4%, and its chance of getting out of the first round from 57% to 45%.
So a trade that keeps Tampa a contender has to bring back about three wins of NHL-ready play this season, not picks and prospects. The lineup would survive the first hit: the Hagel and Anthony Cirelli line that has been his best stays intact, and Brayden Point and Jake Guentzel remain on the top line. The power play is the soft spot. It has converted 16.3% of its chances this season, 27th in the league, with him on it.
Two things make the decision easier than it looks. Retaining salary is cheap for Tampa, because his contract ends this season: keeping half of it costs about $4.75 million of cap this year and nothing after. And the alternative is the summer. If he leaves as a free agent, Tampa gets nothing back, so keeping him is a bet that one more run is worth more than whatever a trade would bring.
The contender: what you buy, and who needs it
A trade this season buys about 4.4 wins over the rest of the year, minus whoever he replaces. For scale, the nineteen wingers who scored 65 to 75 points last season had a median of 2.6 WAR. At our model's rate of about 1.4 standings points per win, that's three to six points depending on how weak the spot he fills is. Here is every team in the conversation on one table, with Tampa Bay for comparison.
| Team | Playoff odds with him (change) | Cup odds with him (change) | 5v5 chances for per game | 5v5 chances against per game | Power play | Cap space today |
|---|---|---|---|---|---|---|
| Tampa Bay without him | 89%−7 | 4.0%−3.3 | 2.248th | 1.8011th | 16.3%27th | $2.8M |
| Carolina | 100%+0 | 41.8%+9.5 | 2.402nd | 1.602nd | 22.6%13th | $5.4M |
| Colorado | 100%+0 | 18.3%+7.4 | 2.1711th | 1.9314th | 19.5%19th | $0.0M |
| Vegas | 100%+1 | 11.6%+4.7 | 2.306th | 1.769th | 27.3%7th | $0.4M |
| Utah | 100%+1 | 11.0%+4.3 | 2.421st | 1.748th | 34.0%2nd | $4.8M |
| New Jersey | 99%+4 | 9.7%+3.7 | 2.344th | 1.674th | 16.7%25th | $0.0M |
| Minnesota | 100%+1 | 9.4%+4.6 | 2.0813th | 1.675th | 25.5%9th | $2.5M |
| Montréal | 98%+7 | 9.4%+4.6 | 2.0812th | 1.7810th | 10.3%31st | $1.5M |
| Edmonton | 100%+1 | 8.4%+4.3 | 1.7623rd | 1.8812th | 35.7%1st | $2.6M |
| Washington | 97%+4 | 7.0%+2.7 | 2.353rd | 2.0822nd | 18.2%21st | $3.1M |
| Dallas | 98%+5 | 5.3%+2.7 | 1.8218th | 1.676th | 20.0%17th | $1.3M |
| Boston | 66%+22 | 2.0%+1.3 | 2.267th | 1.9619th | 20.9%16th | $6.5M |
| Toronto | 15%+10 | 0.2%+0.2 | 1.6928th | 1.9416th | 31.2%5th | $1.7M |
top eight in the leaguebottom eight
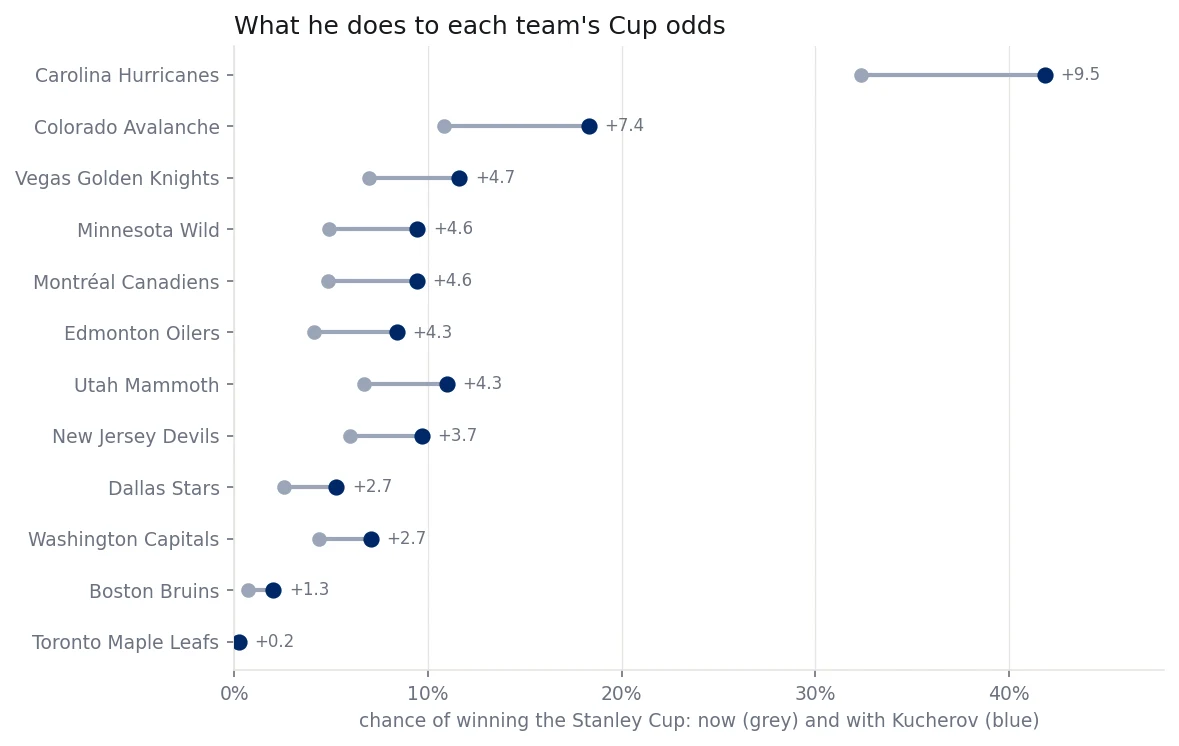
For most contenders he roughly doubles the chance of a Cup, four to five percentage points. Carolina gains the most in absolute terms (+9.5) because our ratings already make the Hurricanes the favorite; Colorado is next (+7.4). Boston gets the biggest regular-season swing, from 44% to 66% to make the playoffs, but getting in isn't getting through: its Cup odds go from 0.7% to 2.0%.
The style columns say where he'd help. Montréal's power play is 31st, and his power-play scoring ranks in the 90th percentile of forwards. Carolina and New Jersey sit in the top four at both ends at 5v5, so they could absorb what he gives up defensively. And on the cap space CapWages lists, only Carolina, Boston and Utah could take him at half price without sending money back.
His role and his line
Start with where he plays. NHL tracking records every skater's position ten times a second in the seconds before each goal, so for every Tampa goal with Kucherov on the ice since 2023-24 we can see where he set up while the puck was in the offensive zone.
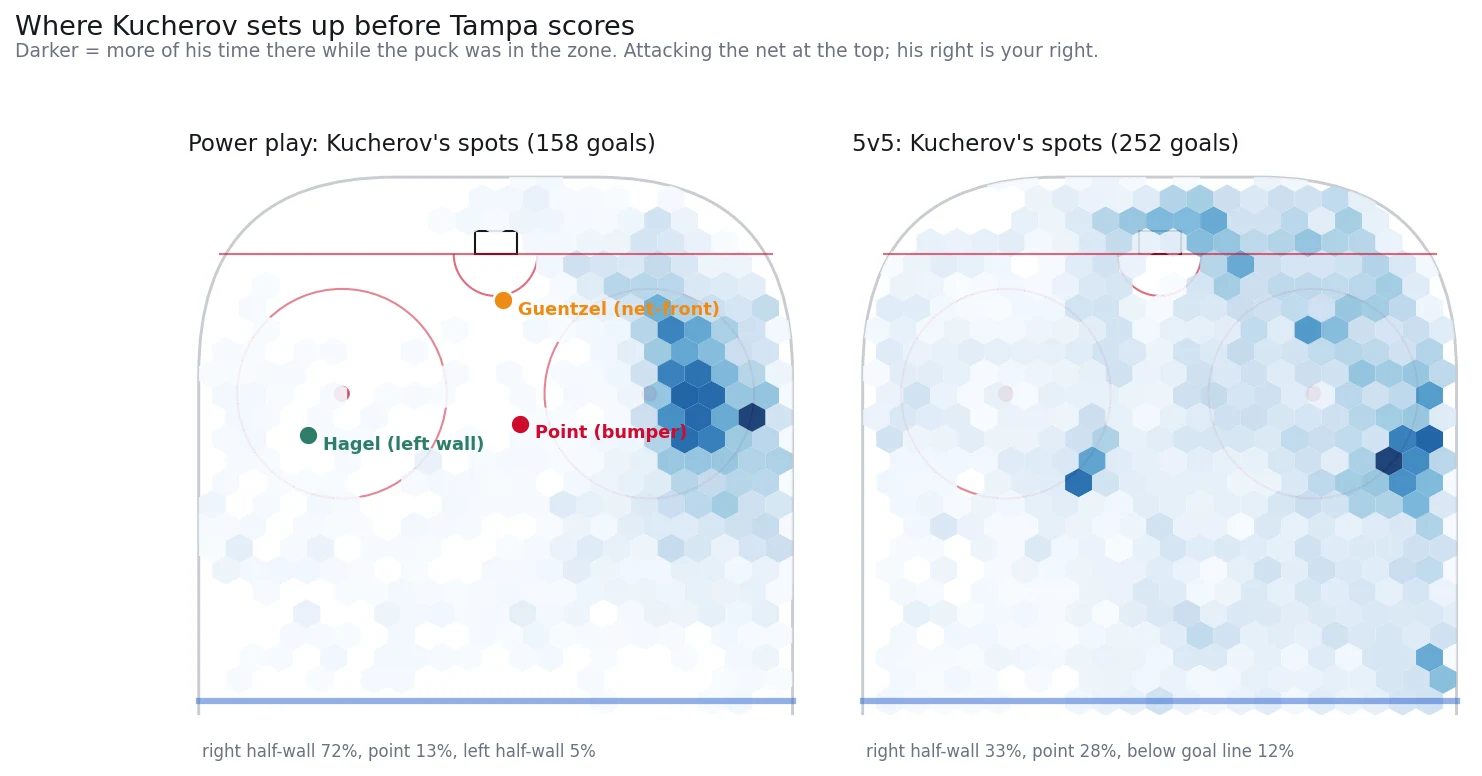
The power play is built around his seat. Kucherov spends 72% of that time on the right half-wall and 13% up top; he is in the bumper, the soft spot between the circles, just 4% of the time. That job belongs to Brayden Point (29% bumper, 29% net-front), with Jake Guentzel at the net (36%) and Hagel on the left wall (49%): a 1-3-1 with Kucherov as the quarterback on the right. At 5v5 he still drifts to the right wall (33%) and up high (28%), and works below the goal line (12%), but he almost never stands in front of the net: 7% of the time, against 21% for Alex Ovechkin. A team that trades for him is buying a half-wall quarterback, and it needs to give him the right flank, a bumper and someone who lives at the net.
The same tracking shows what kind of playmaker he is, against seven of the league's best offensive forwards.
| Player | Primary assists with the pass tracked | Royal-road share | Median pass width | His goals and assists that started in the zone | ...that he carried in himself |
|---|---|---|---|---|---|
| Nathan MacKinnon | 91 | 43% | 18 ft | 51% | 22% |
| Connor McDavid | 114 | 36% | 17 ft | 48% | 25% |
| Nikita Kucherov | 95 | 34% | 21 ft | 56% | 13% |
| Kirill Kaprizov | 46 | 33% | 21 ft | 61% | 13% |
| Artemi Panarin | 64 | 31% | 18 ft | 52% | 16% |
| Leon Draisaitl | 59 | 29% | 18 ft | 58% | 15% |
| Mitch Marner | 84 | 25% | 14 ft | 58% | 15% |
| Jack Hughes | 54 | 24% | 17 ft | 48% | 28% |
About a third of his assists cross the middle of the ice, the royal road, close to McDavid and behind MacKinnon. His passes are the widest of the group, a median 21 feet across. And he rarely carries the puck in himself: 13% of the goals he was part of, tied for the lowest.
The people he passes to score. His 5v5 lines scored 1.34 times their expected goals last season (86 on 64), up from 1.05 three years earlier; the typical forward's lines run at 1.03. He finds the far side of the ice once the puck is in the zone. Someone else has to get it there.
The common advice is that he needs a hard-forechecking winger to win pucks for him. We went back through every forward who played at least 250 even-strength minutes beside him in a season since 2013-14, 36 linemate-seasons, and compared how his line did with that player against how it did without.
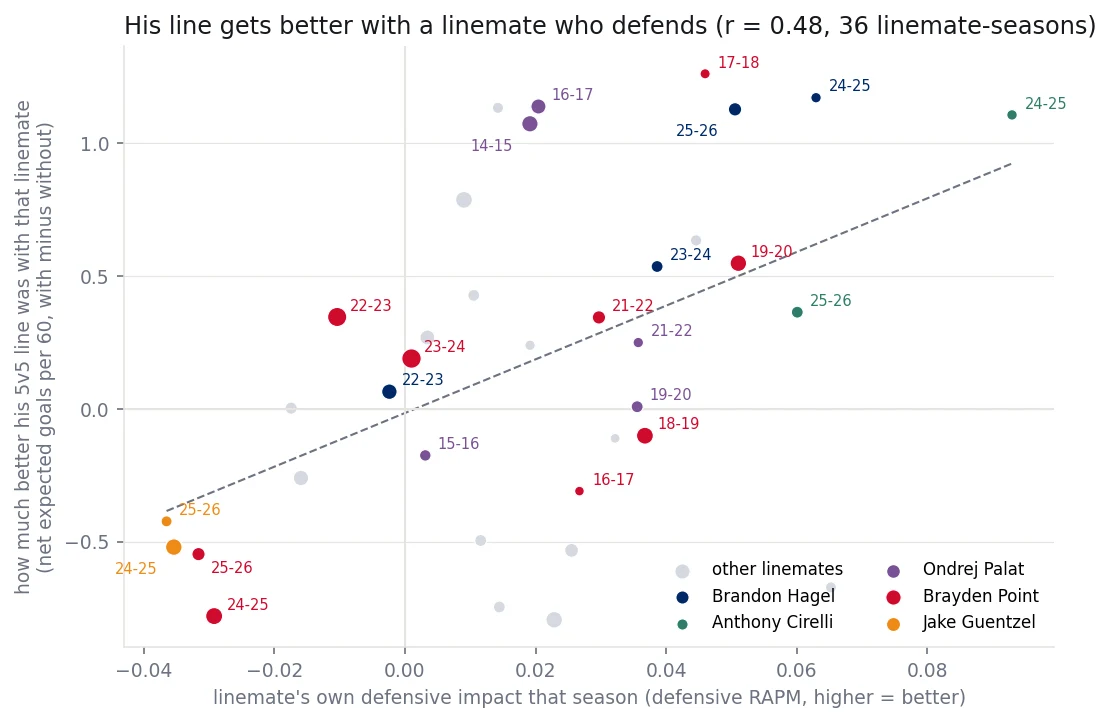
The trait that tracked best was the linemate's own defensive impact, a correlation of 0.48, from a centre (0.45) or a winger (0.54). Takeaways came next (0.34, and 0.53 from centres). Hits had almost nothing to do with it (0.08), and neither did a linemate's own finishing skill (0.04). So of the usual three-man prescription, the puck-winner and the defensive centre hold up and the shooter for his cross-ice passes doesn't. He makes the chances; the linemate's job is the other end.
Hagel shows it best. Over the last three seasons, Kucherov's 5v5 line created 3.67 expected goals per 60 minutes and allowed 2.38 with Hagel, against 3.02 and 2.67 without him. With Brayden Point it allowed more: 2.72 against 2.33.
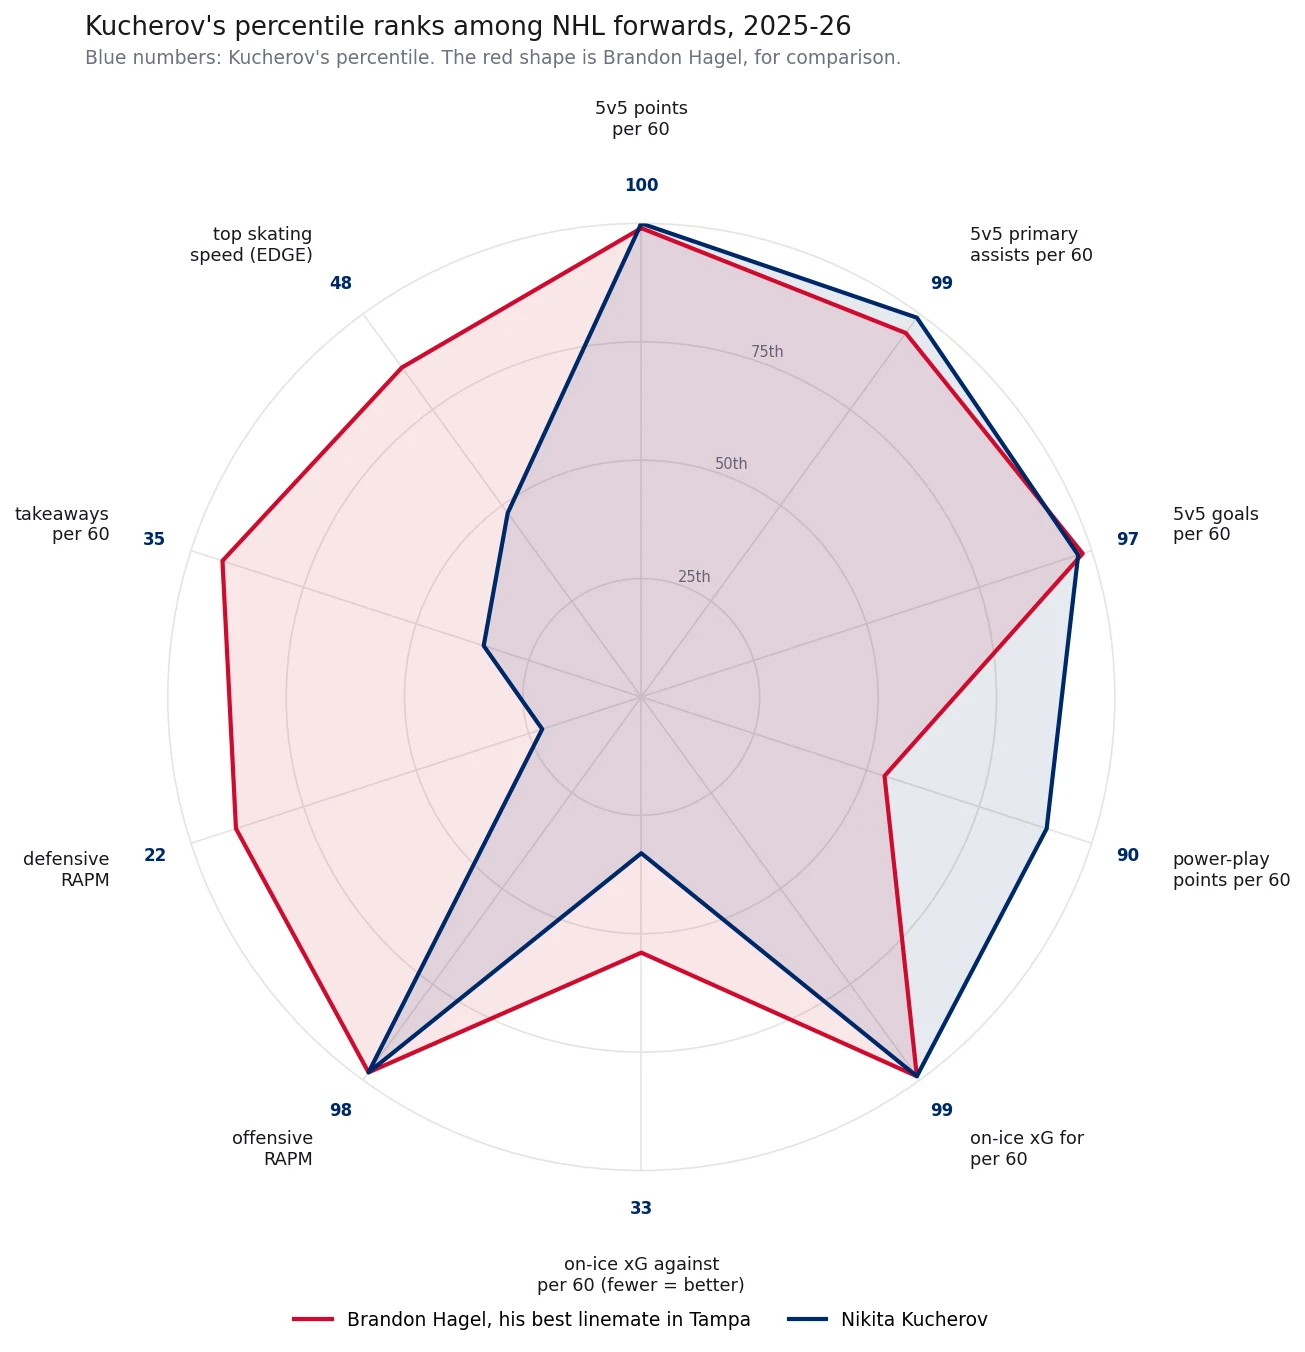
Hagel is on that chart as the benchmark: what Tampa already gives Kucherov, and what a buyer has to replace. On offense they are nearly the same player. Then they split: Hagel ranks in the 90th percentile for defensive impact, the 93rd for takeaways and the 86th for top speed, where Kucherov ranks 22nd, 35th and 48th. That's the shape to look for.
Where he'd play
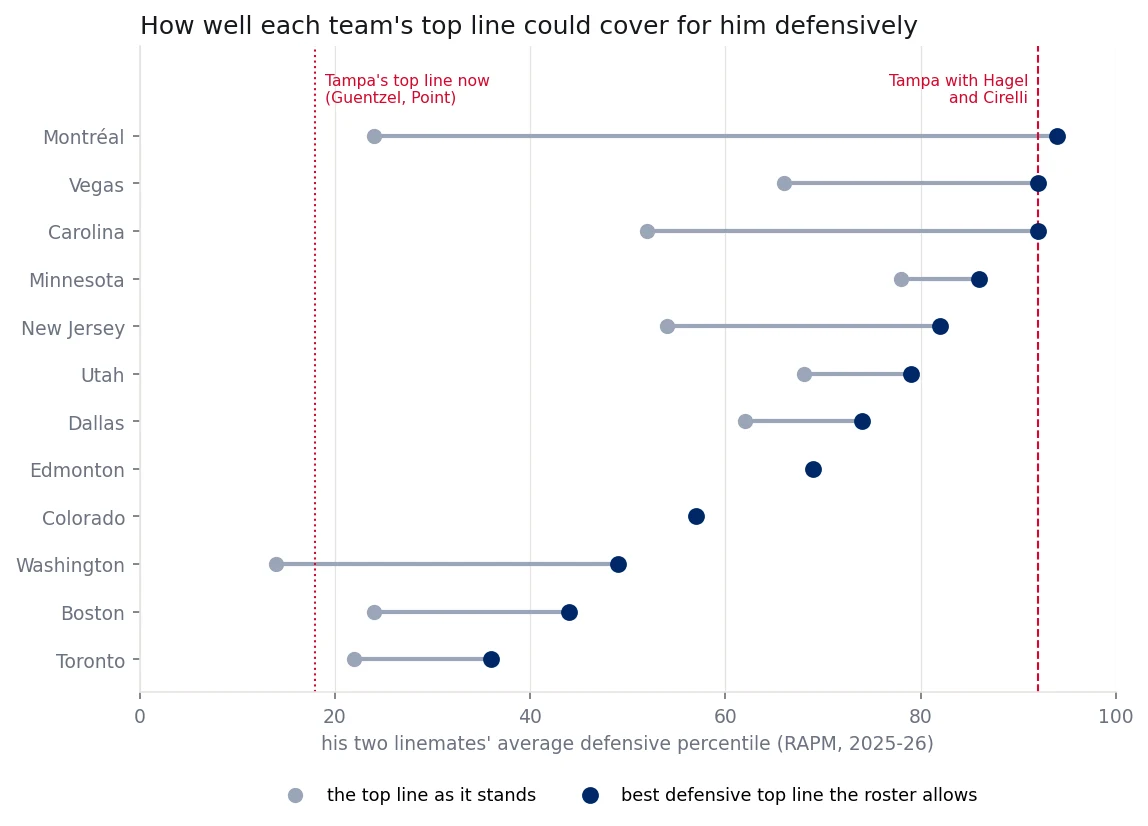
Wherever he goes, he plays on the top line at right wing, and whoever plays there now moves down. So the question is who's beside him. We scored each team two ways: its top line as it stands, and the best defensive top line the roster allows, moving up the strongest defenders among its top three centres and top nine wingers who are at least 40th percentile on offense, so they can keep up. The number is his two linemates' average defensive percentile, against Tampa's top line today (Jake Guentzel and Point, 18th) and a Hagel and Anthony Cirelli line (92nd).
| Team | Top line with him | Linemates' defense (percentile) | Moves down | Already shoots from the right on the first power-play unit |
|---|---|---|---|---|
| Tampa Bay benchmark | Guentzel, Point | 18 | — | Kucherov |
| Minnesota | Kaprizov, Eriksson Ek | 78 | Matt Boldy | Matt Boldy |
| Vegas | Barbashev, Eichel | 66 | Mark Stone | nobody: open |
| Utah | Keller, Schmaltz | 68 | Dylan Guenther | Clayton Keller |
| Edmonton | Podkolzin, McDavid | 69 | Leon Draisaitl | Leon Draisaitl |
| Dallas | Steel, Johnston | 62 | Mikko Rantanen | Mikko Rantanen |
| Colorado | Lehkonen, MacKinnon | 57 | Martin Necas | Nazem Kadri |
| New Jersey | Gritsyuk, Hughes | 54 | Jesper Bratt | Luke Evangelista (light) |
| Carolina | Carrier, Aho | 52 | Andrei Svechnikov | Jackson Blake (light) |
| Montréal | Caufield, Suzuki | 24 | Juraj Slafkovský | Juraj Slafkovský |
| Boston | Peterka, Zacha | 24 | David Pastrnak | JJ Peterka |
| Toronto | McKenna, Matthews | 22 | Jack Roslovic | Auston Matthews |
| Washington | Tuch, Strome | 14 | Jordan Kyrou | Dylan Strome |
Minnesota is the most natural fit. Its top line already defends: Kirill Kaprizov (68th) and Joel Eriksson Ek (88th) average 78, the best of any team without moving anyone, and 86 with Blake Coleman in Kaprizov's place. The catch is the power play, where Matt Boldy, the winger he'd bump, already works the right side. With about $2.5 million of room, Minnesota would need to send back about $2 million even with Tampa keeping half his salary.
Vegas is one move from Tampa's best line. Its top line this season has been Ivan Barbashev, Jack Eichel and Mark Stone, with Mitch Marner on the second line, so Kucherov would bump Stone, not Marner. As it stands he'd play with Barbashev (44th) and Eichel (89th). Slide Stone (96th) over to the left side and the line matches Hagel and Cirelli, and the right side of the Vegas power play is open: Eichel shoots from the left and Stone from both sides. The catch is money: with about $0.4 million of room, Vegas would need to send back about $4 million.
Carolina has the room ($5.4 million, enough to take him at half price) and the biggest Cup gain of anyone, but its top line is offense first: William Carrier (80th) and Sebastian Aho (24th) average 52. Its best defenders, Jordan Martinook (90th) and Mark Jankowski (95th), are its checking line, and promoting both would be a strange way to use a Cup favorite's forwards.
Montréal is the hardest fit. Once Nick Suzuki is back from the upper-body injury that has kept him out since October 20, its top line pairs Kucherov with Cole Caufield (8th) and Suzuki (39th), 24 on average: about as exposed as Tampa's top line. Suzuki's season defensive numbers were better than that last year, but on the per-minute rating that predicts Kucherov's results he is about average; Caufield, in the bottom tenth either way, is the harder problem. The defensive pieces exist, Zachary Bolduc (91st) and Phillip Danault (98th), but the coach would have to build a new top line around them, and Juraj Slafkovský would move down and share the power play's right side with him. David Pagnotta has said the Canadiens would be at the top of his list; with about $1.5 million of room, they'd need to move about $3 million.
Edmonton and Colorado are the star-centre option. Beside Connor McDavid (67th) and Vasily Podkolzin (71st) the line is respectable defensively and absurd offensively, but it moves Leon Draisaitl off the wing and he already owns the right side of the power play. Beside Nathan MacKinnon (36th) and Artturi Lehkonen (78th) it's thinner, and Colorado has almost no room.
Of the rest, Utah (68, or 79 with Barrett Hayton), Dallas (62, or 74) and New Jersey (54, or 82) could build him a decent top line. Boston, Toronto and Washington can't: their top lines would defend like Tampa's, and nothing on the roster changes that much. Boston, at least, can afford him, and its power play is easier than it looks: David Pastrnak shoots mostly from the left.
The verdict
Best fit: Vegas, one move (Stone to the left) from a top line as good defensively as Tampa's best, with an open right side on the power play, if it can move about $4 million.
Most natural fit: Minnesota, whose top line already covers for him, if it can sort out the power play with Boldy.
Best value: Carolina, with the cap room and the biggest Cup gain (32% to 42%), though its top line would leave him exposed.
Hardest to get right: Montréal, reported to be at the top of his list and the team whose power play needs him most, but with one of the weakest top-line fits.
And Tampa should hold out for help it can play now, or keep him and accept the July risk. He costs the Lightning almost nothing to retain.
Where the data comes from
WAR and projections. Our wins-above-replacement model, regular season; projections and market values from our contract model (version 4, September 2026). See the glossary for the components.
Aging. Forwards who averaged at least 2.5 WAR a season (scaled to 82 games) from 30 to 32, 2010-11 to 2025-26: twenty players. A season with no NHL games counts as zero.
Linemates. 5v5 expected goals with and without each forward with 250+ minutes beside him in a season, 2013-14 to 2025-26. 36 linemate-seasons is a small sample: read the correlations as direction, not law. A linemate's defense here, and in the line percentiles, is the per-minute defensive rating from our RAPM model, not the season defense GAR shown on player pages: the season figure tracks his linemates' effect about half as well (a correlation of 0.25 against 0.48), so the two can rank the same player differently.
Playoffs. 40,000 simulated seasons: final points from our standings projection, NHL seeding, best-of-seven series played game by game with our playoff model's math, team strength allowed to drift by about as much as it has from this point to season's end. Our ratings make Carolina a clear favorite, so the gains are the finding more than the absolute odds.
Power-play side and tracking. Power-play shots from the play-by-play, mirrored to one net, with the middle 18 feet counted as neither side. Tracking: regular-season goals, 2023-24 to October 2026; the passer is the last skater to control the puck for 0.3 seconds, which misses one-touch passes. Positions: the bumper is the middle 24 feet between 20 and 45 feet from the goal line, the net-front the same width inside 20 feet, the half-walls everything wider, the point beyond 45 feet; left and right were checked against Alex Ovechkin, who comes out on the left 59% of the time and the right 2%.
Team style and fit. This season's 5v5 expected goals and power-play conversion through October 30, about 13 games per team. Depth charts and standings projection as of October 31; cap space is each team's room under the $104 million ceiling today, as listed by CapWages on October 31, not projected space at the trade deadline. He goes on the top line at right wing; the standings and Cup gains assume the winger who drops out of each top six is its weakest one.
Data: NHL play-by-play and shift charts, regular season, 2010-11 through October 31, 2026; NHL EDGE; Hockey Alchemy WAR, RAPM, standings projection and contract model. Cap space: CapWages, as listed October 31, 2026. News: Sportsnet (Elliott Friedman), ESPN, Daily Faceoff, Montreal Hockey Fanatics (David Pagnotta).
Frequently Asked Questions
Is Nikita Kucherov declining?
Not by our numbers. He was worth 6.2 wins above replacement in 2023-24, 5.4 in 2024-25 and 5.3 in 2025-26, second in the NHL behind Connor McDavid. Our model projects 4.4 this season, with a range of 3.0 to 5.8.
What is Nikita Kucherov worth on a new contract?
Our market-value model puts a five-year deal from age 34 to 38 at about $79 million, roughly $15.8 million a season, with the decline built in. Elite forwards in our data kept about 69% of their age-30-to-32 value at 34 and 53% at 36.
How much would Kucherov change a team's Stanley Cup odds?
In 40,000 simulated seasons, he roughly doubles most contenders' Cup odds: Montreal and Minnesota from 4.9% to 9.4%, Vegas from 7.0% to 11.6%, Colorado from 10.8% to 18.3%. Tampa Bay's falls from 7.3% to about 4% without him.
What kind of linemate does Kucherov need?
A defensive one. Across 36 seasons of Kucherov's linemates since 2013-14, the linemate's own defensive impact was the best predictor of how much better his line was together (correlation 0.48). Hits had almost no relationship (0.08).
More from the Notebook
Our 2026-27 NHL Projection, and Exactly How Much to Discount It
Carolina 111.6 points, Vancouver 79.1 - and luck alone gives the average team an 80% range 21.8 points wide, two-thirds of the league's entire spread. Our measured error says the honest range is closer to 32. The projection beats the honest baseline, and here is exactly how much of the table you should refuse to read as a ranking.
Talent vs Production: Why the Box Score Misleads
Two wingers score 20 goals; only one of them will do it again. The gap between what a player produced and the process underneath it is the most useful idea in hockey analytics - and it is the split our expected-goals and finishing models are built to make.
How Good Is Our WAR Model? We Ran Four Tests and Lost Two
We tested our WAR model against HockeyStats and Evolving Hockey on the four questions an honest player-value model has to answer, matched to each benchmark's published protocol. Summed to a team it loses both tests - it forecasts next season worse than simply reusing last season's standings. Measured per player it wins both, repeating at 0.77 against 0.62 and 0.46.