How Our Power Rankings Work, and Why They Are Not Our Game Odds
2026-11-17 · power-rankings · methodology · Elo
Why we changed our power rankings to describe this season only, how they differ from our game odds, and how we tested both.
Figures computed 2026-11-17, against the models as they stood that day. We change them — see the methodology page for where they are now.
Let’s talk power rankings.
We heard the feedback, we evaluated our methodology, and we’re going to make some changes.
Our objective with these power rankings is to assess a team’s strength, but it has ended up leaning more into the predictive rather than descriptive.
Ahead of our next release, we’re going to do a write-up. Being transparent is important, so we want to make sure the methodology is understood even if you don’t agree.
I made the above post yesterday on my X. Generally we have had a good reception to our content so far, and those who disagree have been respectful. But there has been no model we have built that has generated as much negative comments as our power rankings.
On one side, I’ll take it. It has helped accelerate the growth of the account, through the amount of people who have engaged with our weekly power rankings post. Was the goal to be provocative? Not at all. Whatever the output that day gets shipped and we don’t put our thumb on the scale. This led to 1-2 fanbases per week on an alternating basis weighing in at their bewilderment of these idiotic rankings. Many people would comment essentially the same thing over and over again in a pile on with some variance of shock for what they are seeing. Some were definitely ’Big Mad.’
While it’s been fun to some extent engaging with fans, it’s also started to get annoying over time and has proven to be more of a distraction from the other work I wanted to be a priority for this website. Frankly these power rankings weren’t meant to be priority but unintentionally became some of our highest engagement posts. In an effort to establish some understanding, I would share the power rankings methodology but all they saw was a number and turned red. At this point, doesn’t the unintended start to outweigh the intended effect? I could continue to argue with fans each week but if either side isn’t understanding each other, then kinda what is the point? If one of the goals of this website is to be accessible and build trust, then it feels like I am failing that objective so it’s time to rebuild.
I want to continue to receive and evaluate feedback given my increasing following online. I think that is important. I normally wouldn’t adjust in accordance with outrage, but as a I mentioned above, talking past each other is not a good outcome of this.
So what’s the point of this? I say all this to conclude that the original model was good from a technical perspective and what was it was trying achieve but the argument against it was it was trying to get to the wrong answers and not in the spirit of power rankings.
The original idea for our power rankings was inspired by the former blog, fivethirtyeight. While not perfect, I appreciate their attempt to quantify team strength, which I think is the objective of power rankings. I then took that and tried to over complicate it losing it’s ability to be assessable. While we are not the only analytics website with power rankings, their weekly appearance in people’s feeds brings it to the forefront and got a lot of flack.
And with that let’s get on with it and introduce the new power rankings.
TL;DR
- Two questions we’re trying to answer, so we built two models: power rankings = how good has a team been this season; game odds = who is going to win tonight.
- Power rankings: this season only, record 50% / goal differential 20% / 5v5 xG 30%; 0 = average.
- Game odds: improved xG Elo model, best of each variant tested over 17 seasons; beat our old Elo in 12 of 17 seasons.
- Trying to blend our power rankings with our Elo model made the game odds no better in any season we tested.
- Projected points + playoff odds: our third model, focused on the future, e.g. the standings projection.
Three questions, three models
| Question | Model | What it uses | Where you see it |
|---|---|---|---|
| How good has this team been? | Power rankings | This season’s record, goal differential and 5v5 expected goals | Power rankings, weekly power card |
| Who wins tonight? | Elo with expected goals | Every game since last season, weighted by how much the winner out-chanced the loser | Game odds, today’s-games card, matchup predictor |
| Where will they finish? | Standings projection | Last season, each roster’s projected WAR and this season, played out 10,000 times | Playoff odds, projected points |
Three questions we’re trying to answer, so we built three models. Our power rankings has pivoted to being focused on what has been done, now removing last season entirely (our prior) and weighting less predictive factors in exchange for higher correlation with standings today. Building on top of our base ELO model, we now blend in our xG model to improve it’s ability to pick a winner on any given night.
How the power rankings work
| Part | Weight | What it measures |
|---|---|---|
| Record | 50% | Points percentage |
| Goal differential | 20% | Per game; empty-net goals in, shootouts excluded |
| 5v5 play | 30% | Expected-goal differential per game, 5-on-5 |
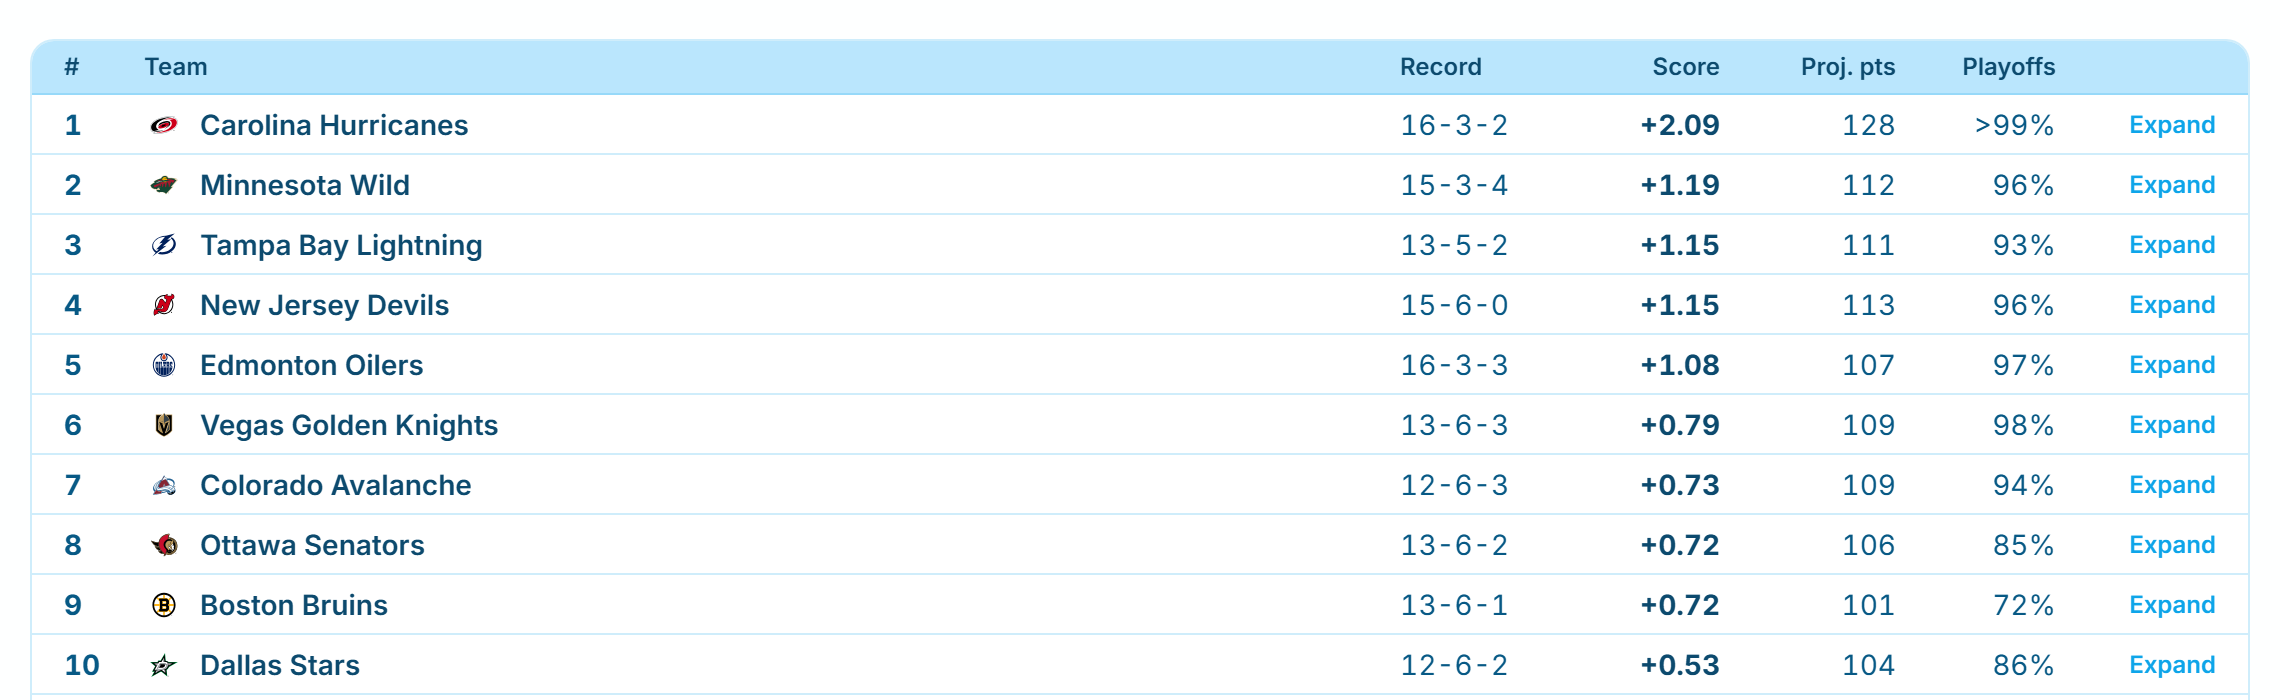
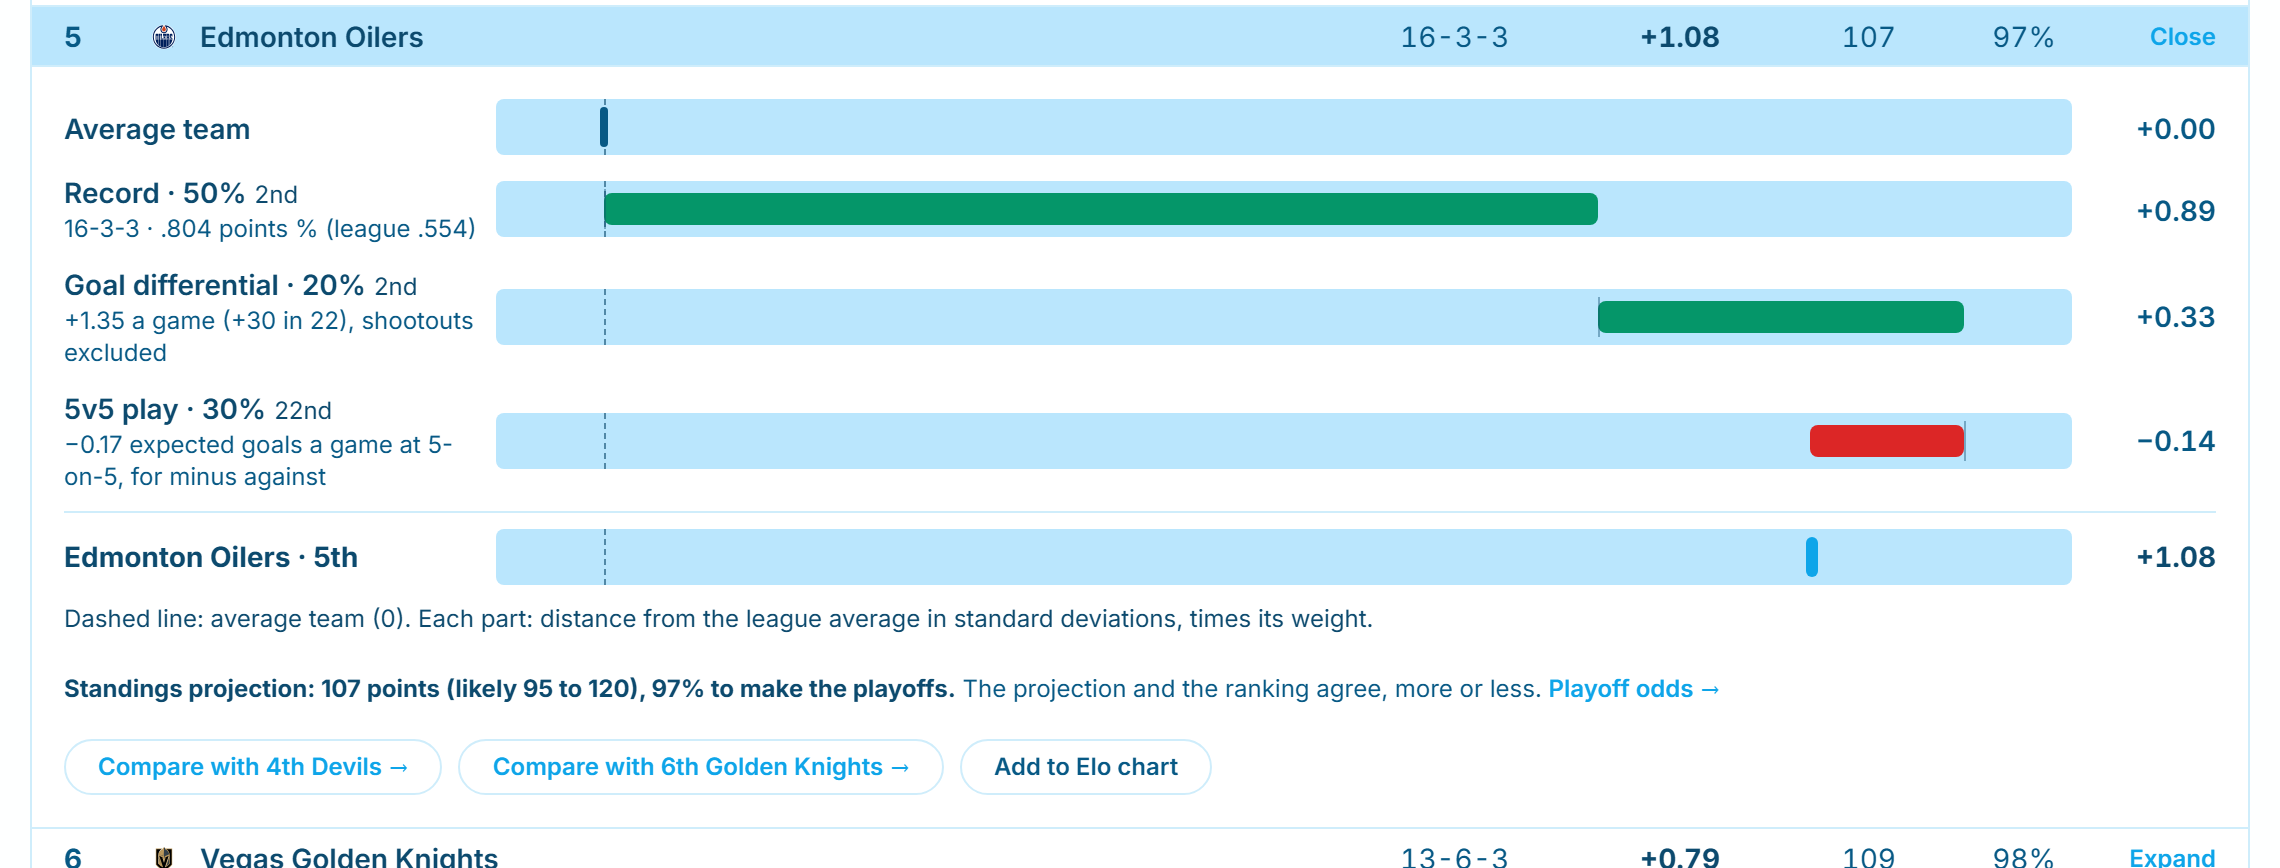
Our power rankings use this season only. Each team gets a score from a combination of three factors (weighting): its record (50%), goal differential (20%) and 5-on-5 expected goals (30%), where 0 represents an average team. Last season and current roster projections are now left out on purpose; those will still feed the standings projection. Our power rankings will never match the standings and that’s kinda the point.
How the game odds work
To begin the season, each team carries a regressed form of last season’s ELO into the new season. After each game, the outcome determines which direction a team moves within the rankings, and depending how much the winner out-chanced the loser sets size of that movement. The team with home ice gains 30 Elo points for the matchup, given two equal teams, historical 54% chance the home team will win. We also account for the second night of a back-to-back, where a team drops a few points of their expected win probability to attempt to quantify fatigue. Our Game Odds model currently has projected the winner 58% of the time. And finally, where then does our expected goals (xG) model fit with the Elo? It starts with the premise that a team could win and get outplayed. To account for that, a team winning while getting out chanced will climb slower. This helps round out the equation.
One team, three answers
| Edmonton, November 17 | Value | League rank |
|---|---|---|
| Points percentage | .804 | 2nd |
| Power rankings score | +1.08 | 5th |
| Elo with expected goals | 1550 | 8th |
| Standings projection | 107 points, 97% playoff odds | 7th |
Let’s use the Edmonton Oilers as an example for how each of the models fit. We’ll start with the record, which is elite, the goal differential is good, 5v5 play is slightly below average, so the ranking puts them fifth. Elo utilizes last season as a starting point at the beginning of the season and evolves with how they’ve won. The Oilers currently rank eighth. The standings projection knows the roster and their performance and expects some of the hot start to cool. All three models are right about answering their own question.
Contrast this with Carolina, first in all three (+2.09; 128 projected points), when the past, present, and future are aligned.
How we tested them
| Rating, 13 seasons | Matches the standings | Predicts the rest of the season |
|---|---|---|
| Power rankings | 0.92 | 0.49 |
| Elo with expected goals | 0.74 | 0.55 |
| Standings projection | 0.70 | 0.58 |
| Game odds, 17 seasons | Picked the winner |
|---|---|
| Elo with expected goals | 57.6% |
| Our older Elo (results only) | 57.2% |
| Power rankings as odds | 57.6% |
| Elo with expected goals plus the power rankings | 57.6% |
| Every team equal, home ice only | 54.2% |
We primarily looked through two different lens: current standings (descriptive) and standings projections (predictive). We ran each model across metrics and across season. We looked at rankings across the past 13 seasons, assess at different intervals (10, 20, 30, 41 games). For game odds we looked at the past 17 seasons, starting from the 10th game to eliminate early season noise. Power rankings were best at describing this season; standings projection at predicting the rest; Elo at single games. The honest cost of changing methodology is our power rankings predict worst; that’s the trade-off for being explainable from this season alone.
This season so far
| 2026-27, after the 10-game mark | Predicted points per game since (rank agreement) |
|---|---|
| Power rankings | 0.53 |
| Elo with expected goals | 0.67 |
| Standings projection | 0.69 |
This season so far has the same pattern as previous seasons. This season’s first ten games said less about the next ten than last season and the roster projections did. About ten games per team since the cut, so treat it as a check, not proof.
What we don’t include
A reminder that our game odds shouldn’t be used for gambling. Besides our personal opinion, we haven’t made the necessary adjustments or incorporated the data to be real-time enough to have any certainty of trust. We publish early enough in the day that complete data is not available and we don’t incorporate starting goalies, injuries, or any lineup news. Again, these game odds are not meant to be and shouldn’t be used as a betting line.
Frequently Asked Questions
What goes into the power rankings?
Our power rankings model follows a very simple heuristic formula: its record (50%), goal differential (20%) and 5-on-5 expected goals (30%).
Why does a team's power rank differ from its place in the standings?
We firmly believe a team's record doesn't always represent them. Our goal is trying to understand team strength in the now.
Where do the game odds come from?
From an Elo rating built on expected goals. Wins and losses decide which way a team moves; how much it out-chanced the other team decides how far.
Why not use the power rankings for game odds?
We tested it over 17 seasons. The power rankings did no better than Elo at predicting games, and adding them to Elo didn't help either.
More from the Notebook
How We Rebuilt Our Expected Goals Model
Measured on shots it had never seen, our old expected goals model was not as good as we thought. We found where the data and the model were wrong and rebuilt both. Here is what changed, why, and how much better the new model is.
How Good Is Our WAR Model? We Ran Four Tests and Lost Two
We tested our WAR model against HockeyStats and Evolving Hockey on the four questions an honest player-value model has to answer, matched to each benchmark's published protocol. Summed to a team it loses both tests - it forecasts next season worse than simply reusing last season's standings. Measured per player it wins both, repeating at 0.77 against 0.62 and 0.46.
What to Expect With Jim Hiller
Toronto tried the Cup-pedigree hire and Auston Matthews cratered. What Jim Hiller's actual Kings numbers — and our metrics — say to expect from the Leafs' next coach.